Debugging
Debugging your WunderGraph application
Visual Studio Code
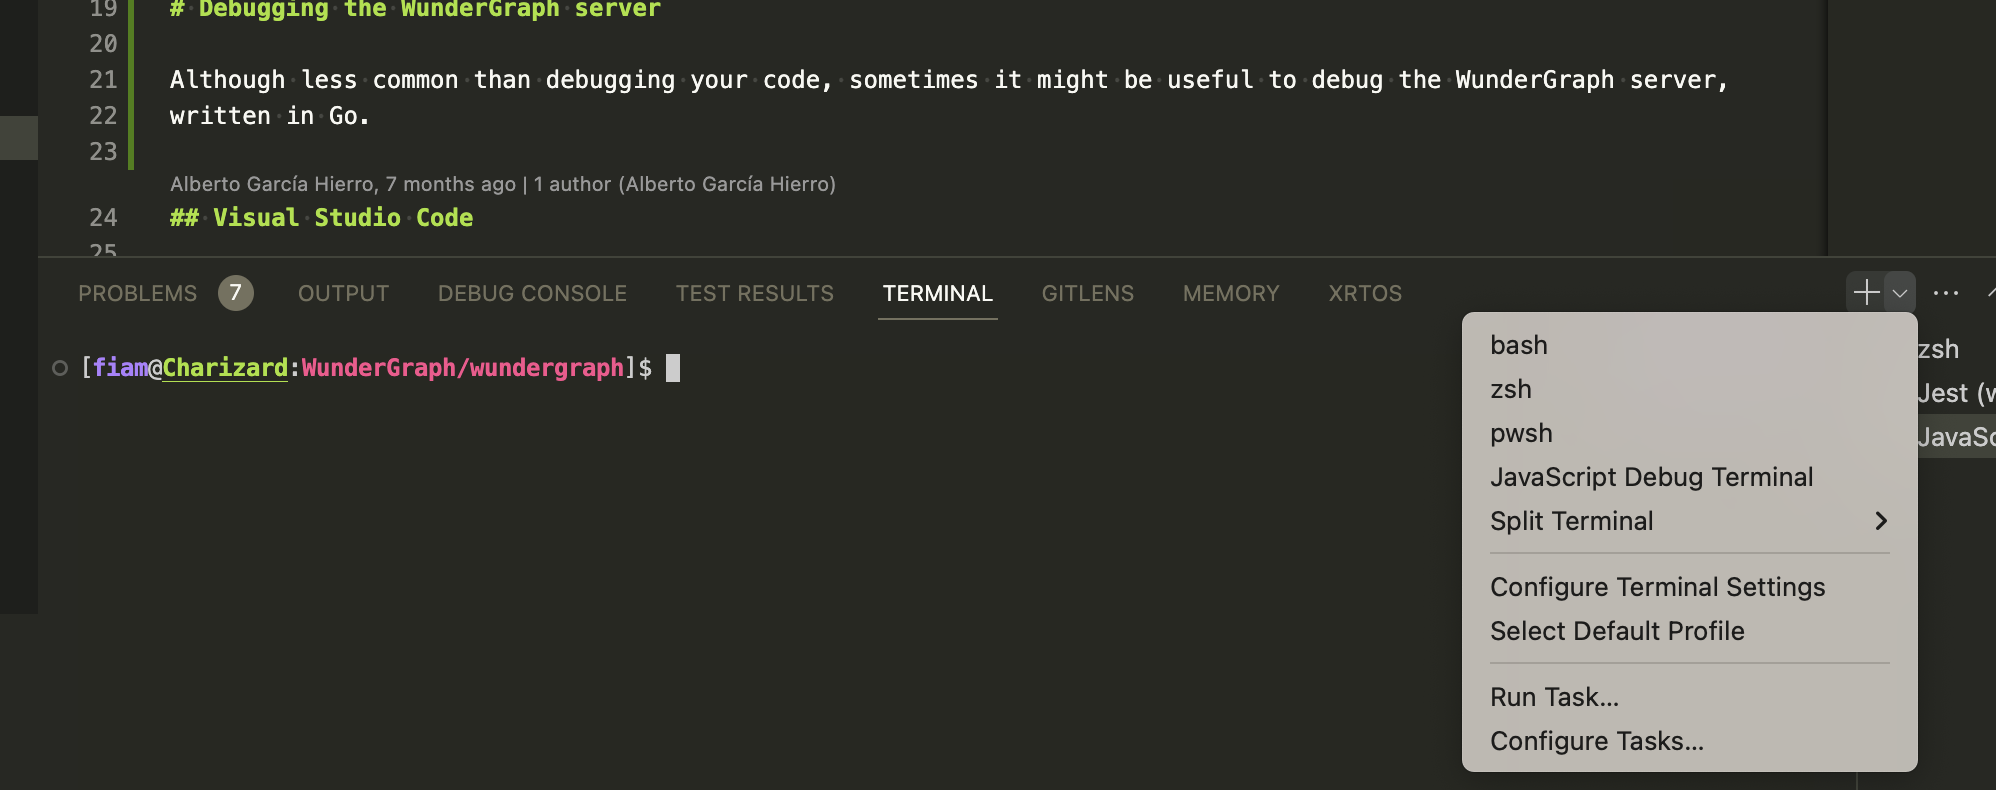
Visual Studio Code includes built-in support for debugging JavaScript/TypeScript, making it convenient to debug your hooks or functions in your WunderGraph application. To utilize the JavaScript Debug Terminal, follow these steps:
- Open Visual Studio Code and navigate to the bottom pane.
- Select the
TERMINALtab. - Click the
+symbol to open a new terminal. - Choose
Javascript Debug Terminal.

From the newly opened terminal, launch your application using either npm start or wunderctl up. This will run your JavaScript based code inside a debugger, allowing execution to halt at your breakpoints.
Debugging the WunderGraph server
If you need to debug the WunderGraph node, which is written in Go, you can follow these steps in Visual Studio Code:
Visual Studio Code
Install Go language support for VSCode . Make sure to install additonal tools when they pop up, or manually run
Go: Install/Update Tools commandfrom the command palette.Add the configuration to your
launch.jsonfile. Replace MY_CODE_DIR with the absolute path to your project's.wundergraphdirectory.
- Set your breakpoints and run "Launch WunderGraph" from the debug menu.